Host portfolios
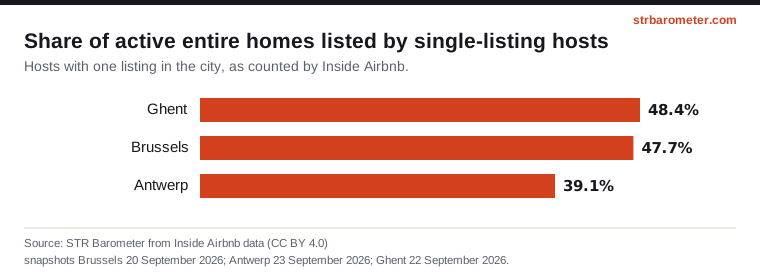
Each active entire home is grouped by the number of listings its host has in the same city. The first table shows how the active homes split between those groups; the second, how the figures differ.
Brussels
| Active entire homes | Share | Median nightly rate | Nights booked (est. median) | Gross revenue, 365 days (est. median) | |
|---|---|---|---|---|---|
| 1 listing | 1,156 | 47.7% | €142 | 114 | €15,600 |
| 2 to 5 listings | 767 | 31.6% | €141 | 174 | €22,100 |
| 6 to 20 listings | 356 | 14.7% | €138 | 147 | €17,800 |
| more than 20 listings | 146 | 6.0% | €139 | 180 | €24,400 |
Antwerp
| Active entire homes | Share | Median nightly rate | Nights booked (est. median) | Gross revenue, 365 days (est. median) | |
|---|---|---|---|---|---|
| 1 listing | 535 | 39.1% | €141 | 90 | €13,700 |
| 2 to 5 listings | 389 | 28.4% | €140 | 90 | €14,800 |
| 6 to 20 listings | 258 | 18.8% | €126 | 102 | €12,600 |
| more than 20 listings | 188 | 13.7% | €146 | 54 | €7,800 |
Ghent
| Active entire homes | Share | Median nightly rate | Nights booked (est. median) | Gross revenue, 365 days (est. median) | |
|---|---|---|---|---|---|
| 1 listing | 347 | 48.4% | €160 | 102 | €18,300 |
| 2 to 5 listings | 225 | 31.4% | €163 | 126 | €23,300 |
| 6 to 20 listings | 113 | 15.8% | €158 | 180 | €28,600 |
| more than 20 listings | 32 | 4.5% | €159 | 93 | €14,300 |
The portfolio count is Inside Airbnb's count of all the host's listings in the city, including rooms. A professional manager acting for many owners appears as one host with many listings.
Source: STR Barometer from Inside Airbnb data (CC BY 4.0), snapshots Brussels 20 September 2026; Antwerp 23 September 2026; Ghent 22 September 2026. Methodology.
How to cite
STR Barometer, “Host portfolios”, from Inside Airbnb data (CC BY 4.0), snapshots: Brussels 20 September 2026, Antwerp 23 September 2026, Ghent 22 September 2026. https://strbarometer.com/findings/host-portfolios/