Barometer / Dublin
Ireland
Dublin
2,266 active entire homes in the Inside Airbnb snapshot of 17 September 2026, out of 6,748 listings of every type. Prices in euros.
€250Median nightly rate · Middle half €179–€369
104Nights booked (est. median) · 28.5% of the year
€25,000Gross revenue, 365 days (est. median) · Middle half €9,300–€45,700
57.6%Entire-home share · 3,884 / 6,748
2,266Active entire homes · 58.3% entire homes
The busiest month for stays is August (13.5% of the year's reviews), the quietest January (3.7%). 4 areas have at least 25 active entire homes and can be shown on their own.
The Dublin file is organised by the four local authority areas of County Dublin rather than by neighbourhood, so the area table below has four lines. Prices are in euros.
By number of bedrooms
| Active entire homes | Median nightly rate | Nights booked (est. median) | Gross revenue, 365 days (est. median) | Middle half | |
|---|---|---|---|---|---|
| Studio | 77 | €148 | 156 | €18,700 | €11,000–€34,000 |
| 1 bedroom | 865 | €183 | 132 | €22,700 | €8,400–€37,500 |
| 2 bedrooms | 805 | €291 | 96 | €25,900 | €9,500–€53,100 |
| 3+ bedrooms | 514 | €446 | 60 | €30,900 | €10,000–€66,900 |
Areas
| Area | Active entire homes | Median nightly rate | Nights booked (est. median) | Estimated occupancy | Gross revenue, 365 days (est. median) |
|---|---|---|---|---|---|
| Dún Laoghaire-Rathdown | 243 | €256 | 42 | 11.5% | €12,500 |
| Dublin City | 1,696 | €251 | 120 | 32.9% | €28,100 |
| Fingal | 242 | €246 | 102 | 27.9% | €23,500 |
| South Dublin | 85 | €222 | 56 | 15.3% | €13,100 |
Seasonality
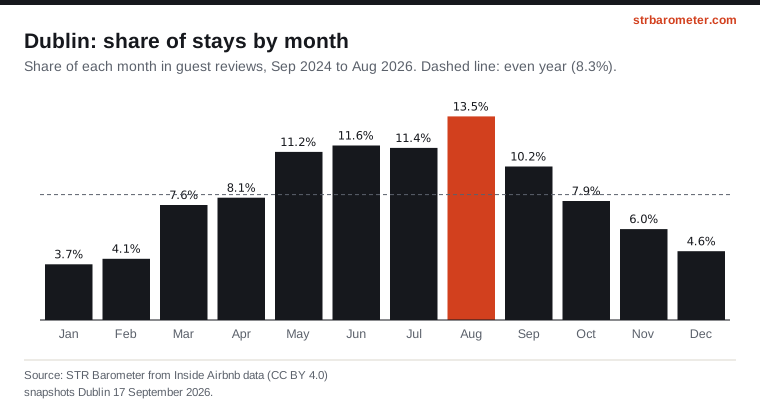
Source: STR Barometer from Inside Airbnb data (CC BY 4.0), snapshots Dublin 17 September 2026. Methodology.
How to cite
STR Barometer, “Short-term rentals in Dublin: key figures”, from Inside Airbnb data (CC BY 4.0), snapshots: Dublin 17 September 2026. https://strbarometer.com/cities/dublin/