Barometer / London
United Kingdom
London
27,828 active entire homes in the Inside Airbnb snapshot of 17 September 2026, out of 91,954 listings of every type. Prices in pounds sterling.
£220Median nightly rate · Middle half £160–£317
64Nights booked (est. median) · 17.5% of the year
£14,100Gross revenue, 365 days (est. median) · Middle half £5,600–£32,400
66.4%Entire-home share · 61,074 / 91,954
27,828Active entire homes · 45.6% entire homes
The busiest month for stays is July (12.6% of the year's reviews), the quietest February (5.5%). 33 areas have at least 25 active entire homes and can be shown on their own.
London is by far the largest dataset on the site and the only one in pounds sterling. Areas are the 32 boroughs plus the City of London. Compare London with the other cities through nights booked, shares and seasonality, not through prices.
By number of bedrooms
| Active entire homes | Median nightly rate | Nights booked (est. median) | Gross revenue, 365 days (est. median) | Middle half | |
|---|---|---|---|---|---|
| Studio | 1,272 | £151 | 74 | £11,000 | £4,200–£24,800 |
| 1 bedroom | 12,259 | £172 | 64 | £11,300 | £4,400–£25,300 |
| 2 bedrooms | 9,050 | £258 | 64 | £16,700 | £7,000–£39,200 |
| 3+ bedrooms | 5,235 | £351 | 55 | £19,000 | £7,500–£48,000 |
Areas
The 8 areas with the highest median nightly rate.
| Area | Active entire homes | Median nightly rate | Nights booked (est. median) | Estimated occupancy | Gross revenue, 365 days (est. median) |
|---|---|---|---|---|---|
| Westminster | 4,513 | £296 | 83 | 22.7% | £23,500 |
| Kensington and Chelsea | 2,749 | £271 | 64 | 17.5% | £18,300 |
| City of London | 282 | £261 | 64 | 17.5% | £17,200 |
| Camden | 2,228 | £250 | 83 | 22.7% | £19,900 |
| Wandsworth | 1,225 | £240 | 46 | 12.6% | £12,100 |
| Hammersmith and Fulham | 1,432 | £219 | 64 | 17.5% | £14,400 |
| Islington | 1,356 | £215 | 74 | 20.3% | £17,200 |
| Southwark | 1,314 | £215 | 64 | 17.5% | £14,800 |
Seasonality
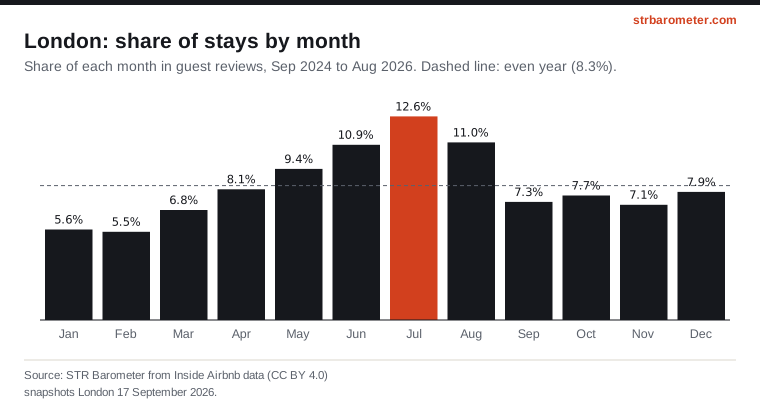
Source: STR Barometer from Inside Airbnb data (CC BY 4.0), snapshots London 17 September 2026. Methodology.
How to cite
STR Barometer, “Short-term rentals in London: key figures”, from Inside Airbnb data (CC BY 4.0), snapshots: London 17 September 2026. https://strbarometer.com/cities/london/