Seasonality
When in the year guests stay, measured by the share of each calendar month in all reviews written over 24 complete months.
Peak and quietest month
| City | Peak month | Share | Quietest month | Share | Peak ÷ quietest |
|---|---|---|---|---|---|
| Brussels | July | 10.0% | January | 5.9% | 1.7 |
| Antwerp | August | 11.3% | January | 5.7% | 2.0 |
| Ghent | August | 12.0% | January | 4.9% | 2.4 |
| Dublin | August | 13.5% | January | 3.7% | 3.7 |
| London | July | 12.6% | February | 5.5% | 2.3 |
Monthly profile by city
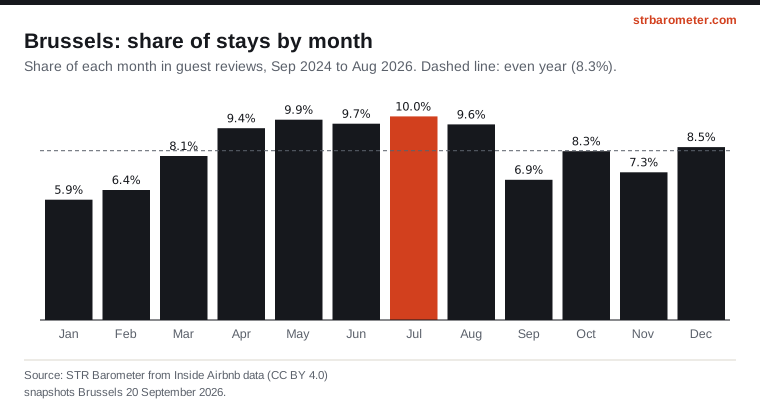
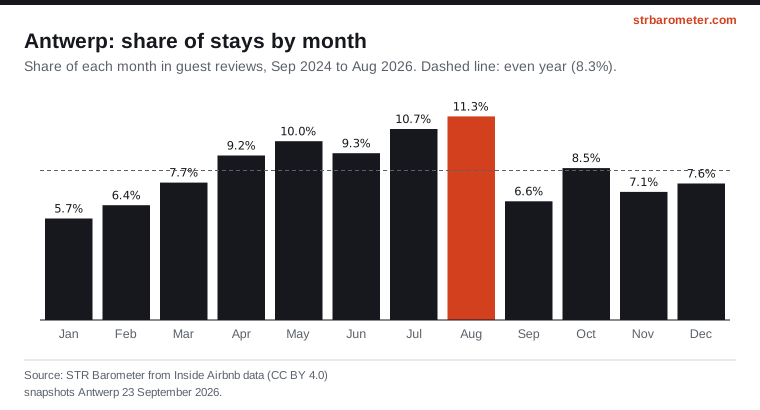
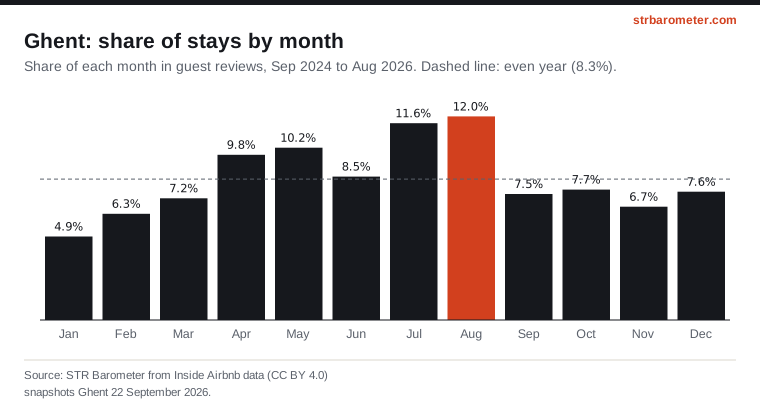
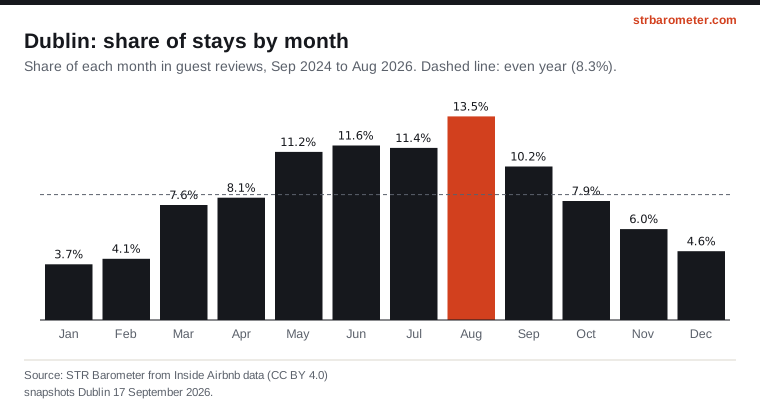
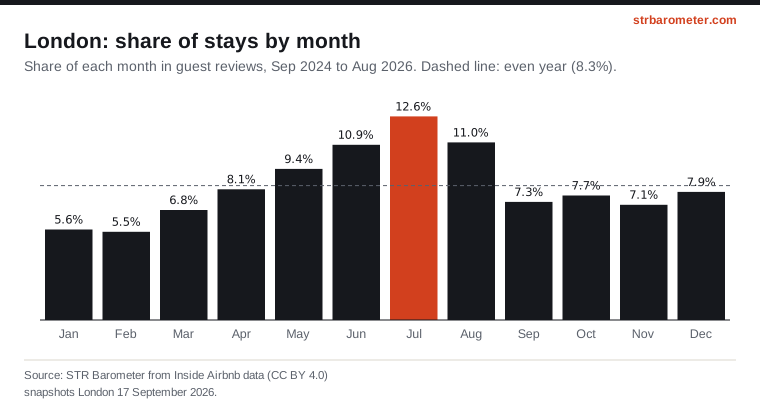
All monthly shares
| Month | Brussels | Antwerp | Ghent | Dublin | London |
|---|---|---|---|---|---|
| January | 5.9% | 5.7% | 4.9% | 3.7% | 5.6% |
| February | 6.4% | 6.4% | 6.3% | 4.1% | 5.5% |
| March | 8.1% | 7.7% | 7.2% | 7.6% | 6.8% |
| April | 9.4% | 9.2% | 9.8% | 8.1% | 8.1% |
| May | 9.9% | 10.0% | 10.2% | 11.2% | 9.4% |
| June | 9.7% | 9.3% | 8.5% | 11.6% | 10.9% |
| July | 10.0% | 10.7% | 11.6% | 11.4% | 12.6% |
| August | 9.6% | 11.3% | 12.0% | 13.5% | 11.0% |
| September | 6.9% | 6.6% | 7.5% | 10.2% | 7.3% |
| October | 8.3% | 8.5% | 7.7% | 7.9% | 7.7% |
| November | 7.3% | 7.1% | 6.7% | 6.0% | 7.1% |
| December | 8.5% | 7.6% | 7.6% | 4.6% | 7.9% |
| Reviews counted | 163,433 | 61,108 | 46,784 | 166,373 | 1,007,868 |
Reviews are written shortly after a stay, so their monthly distribution is a proxy for when stays happen. Each month counts twice (two years), which smooths out a single unusual month. A flat year would give 8.3% per month: anything above means more stays than average in that month.
The profile has no currency and no estimation model behind it beyond the review itself, which makes it one of the more robust comparisons between the five cities.
This is a share of the year, not a volume: a city with a flatter profile is not a city with fewer stays.
Source: STR Barometer from Inside Airbnb data (CC BY 4.0), snapshots Brussels 20 September 2026; Antwerp 23 September 2026; Ghent 22 September 2026; Dublin 17 September 2026; London 17 September 2026. Methodology.
STR Barometer, “Seasonality”, from Inside Airbnb data (CC BY 4.0), snapshots: Brussels 20 September 2026, Antwerp 23 September 2026, Ghent 22 September 2026, Dublin 17 September 2026, London 17 September 2026. https://strbarometer.com/indicators/seasonality/