Nights booked
How many nights a typical active entire home was booked over the last 365 days, according to Inside Airbnb's occupancy model.
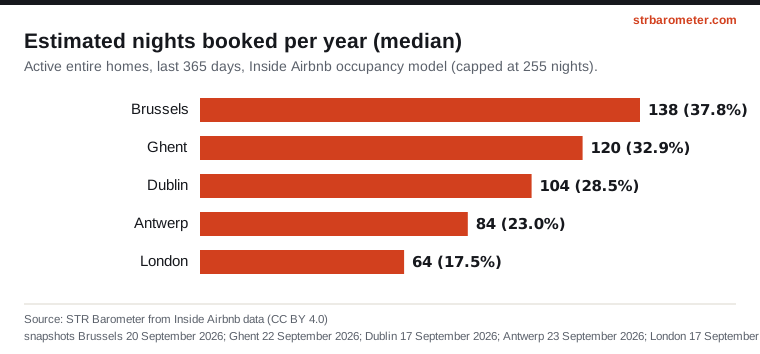
| City | Active entire homes | Lower quartile | Median | Upper quartile | Estimated occupancy |
|---|---|---|---|---|---|
| Brussels | 2,425 | 48 | 138 | 255 | 37.8% |
| Antwerp | 1,370 | 32 | 84 | 192 | 23.0% |
| Ghent | 717 | 54 | 120 | 240 | 32.9% |
| Dublin | 2,266 | 36 | 104 | 210 | 28.5% |
| London | 27,828 | 28 | 64 | 147 | 17.5% |
By number of bedrooms (median nights)
| City | Studio | 1 bedroom | 2 bedrooms | 3+ bedrooms |
|---|---|---|---|---|
| Brussels | 126 | 150 | 132 | 108 |
| Antwerp | 84 | 90 | 78 | 78 |
| Ghent | 120 | 132 | 117 | 90 |
| Dublin | 156 | 132 | 96 | 60 |
| London | 74 | 64 | 64 | 55 |
The figure is an estimate built from reviews: Inside Airbnb assumes a review rate and an average stay, then caps the result at 255 nights a year. Homes whose guests rarely leave a review are underestimated; homes with a long minimum stay are counted with that stay length.
Because it has no currency, this is the indicator to use when London is compared with the other four cities. The share of the year is the same number divided by 365, given for readability only.
Write "an estimated X nights booked" or "estimated occupancy", never "occupancy rate" on its own: no booking was measured.
Source: STR Barometer from Inside Airbnb data (CC BY 4.0), snapshots Brussels 20 September 2026; Antwerp 23 September 2026; Ghent 22 September 2026; Dublin 17 September 2026; London 17 September 2026. Methodology.
STR Barometer, “Nights booked”, from Inside Airbnb data (CC BY 4.0), snapshots: Brussels 20 September 2026, Antwerp 23 September 2026, Ghent 22 September 2026, Dublin 17 September 2026, London 17 September 2026. https://strbarometer.com/indicators/nights-booked/