Nightly rate
The price a guest is asked for one night in an active entire home, as shown on the listing on the snapshot date, before cleaning and service fees.
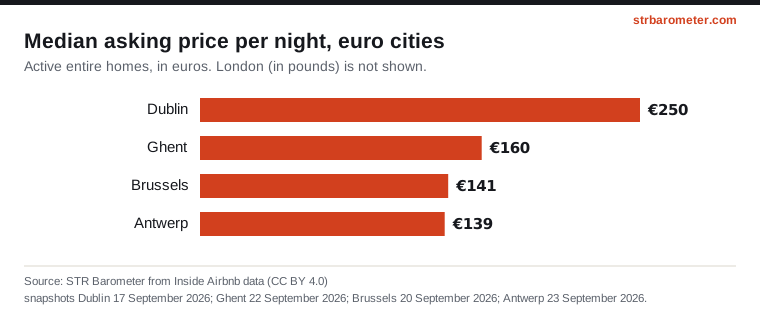
| City | Active entire homes | Lower quartile | Median | Upper quartile |
|---|---|---|---|---|
| Brussels | 2,425 | €110 | €141 | €189 |
| Antwerp | 1,370 | €106 | €139 | €186 |
| Ghent | 717 | €127 | €160 | €214 |
| Dublin | 2,266 | €179 | €250 | €369 |
| London | 27,828 | £160 | £220 | £317 |
By number of bedrooms (median)
| City | Studio | 1 bedroom | 2 bedrooms | 3+ bedrooms |
|---|---|---|---|---|
| Brussels | €115 | €126 | €186 | €297 |
| Antwerp | €100 | €122 | €166 | €261 |
| Ghent | €129 | €143 | €205 | €303 |
| Dublin | €148 | €183 | €291 | €446 |
| London | £151 | £172 | £258 | £351 |
This is an asking price for one date. Hosts change prices by season, weekday and demand, so the same home may show a different rate a month later. Use the figure to describe the typical level of prices at a given moment, not what guests paid on average over the year.
The middle half shows how wide the market is: half of the active homes are priced between the two quartiles. The bedroom table separates studios from larger homes, which is usually the first question when two cities look different.
London is in pounds sterling and the other cities in euros. No exchange rate is applied, so the euro chart leaves London out; London's figures stand in the table.
Source: STR Barometer from Inside Airbnb data (CC BY 4.0), snapshots Brussels 20 September 2026; Antwerp 23 September 2026; Ghent 22 September 2026; Dublin 17 September 2026; London 17 September 2026. Methodology.
STR Barometer, “Nightly rate”, from Inside Airbnb data (CC BY 4.0), snapshots: Brussels 20 September 2026, Antwerp 23 September 2026, Ghent 22 September 2026, Dublin 17 September 2026, London 17 September 2026. https://strbarometer.com/indicators/nightly-rate/