Gross revenue
What a typical active entire home took in over the last 365 days, according to Inside Airbnb's estimate built from asking price and estimated nights — before any fee or cost.
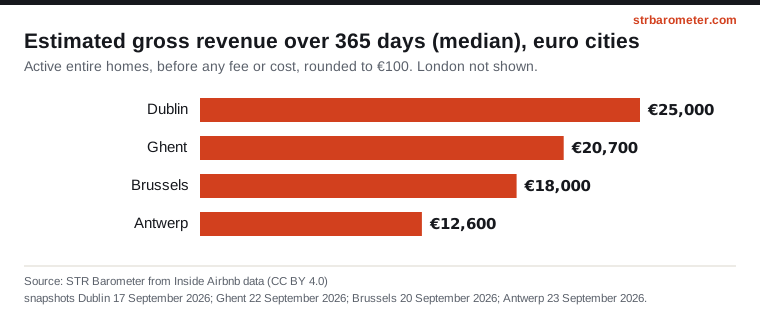
| City | Active entire homes | Lower quartile | Median | Upper quartile |
|---|---|---|---|---|
| Brussels | 2,425 | €7,300 | €18,000 | €31,900 |
| Antwerp | 1,370 | €4,700 | €12,600 | €24,400 |
| Ghent | 717 | €8,100 | €20,700 | €35,300 |
| Dublin | 2,266 | €9,300 | €25,000 | €45,700 |
| London | 27,828 | £5,600 | £14,100 | £32,400 |
By number of bedrooms (median)
| City | Studio | 1 bedroom | 2 bedrooms | 3+ bedrooms |
|---|---|---|---|---|
| Brussels | €12,900 | €16,400 | €23,700 | €29,700 |
| Antwerp | €7,800 | €11,400 | €14,200 | €21,900 |
| Ghent | €14,200 | €18,700 | €23,100 | €27,900 |
| Dublin | €18,700 | €22,700 | €25,900 | €30,900 |
| London | £11,000 | £11,300 | £16,700 | £19,000 |
Revenue combines the two previous estimates, so it inherits both of their limits: an asking price at one date and nights estimated from reviews. It is a gross figure, before platform commission, cleaning, management, utilities, maintenance and any levy.
The middle half is wide in every city: the gap between the lower and the upper quartile is usually larger than the gap between cities. That spread is the more robust finding.
Never call this figure income, earnings or profit. London is in pounds; the euro chart leaves it out.
Source: STR Barometer from Inside Airbnb data (CC BY 4.0), snapshots Brussels 20 September 2026; Antwerp 23 September 2026; Ghent 22 September 2026; Dublin 17 September 2026; London 17 September 2026. Methodology.
STR Barometer, “Gross revenue”, from Inside Airbnb data (CC BY 4.0), snapshots: Brussels 20 September 2026, Antwerp 23 September 2026, Ghent 22 September 2026, Dublin 17 September 2026, London 17 September 2026. https://strbarometer.com/indicators/gross-revenue/