Entire homes
Out of all listings in a city's file, the share offering a whole home rather than a room — and, among those entire homes, the share that is active.
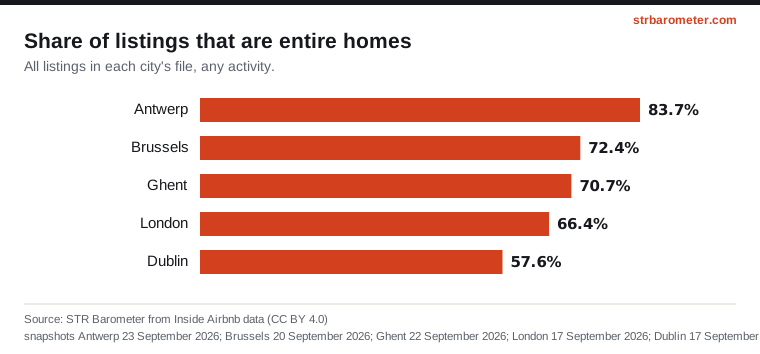
| City | All listings | Entire homes | Entire-home share | Active entire homes | Active share of entire homes |
|---|---|---|---|---|---|
| Brussels | 4,850 | 3,509 | 72.4% | 2,425 | 69.1% |
| Antwerp | 2,463 | 2,062 | 83.7% | 1,370 | 66.4% |
| Ghent | 1,367 | 966 | 70.7% | 717 | 74.2% |
| Dublin | 6,748 | 3,884 | 57.6% | 2,266 | 58.3% |
| London | 91,954 | 61,074 | 66.4% | 27,828 | 45.6% |
Listing types in the three Belgian cities
| Type | Brussels | Antwerp | Ghent |
|---|---|---|---|
| Entire home | 3,509 (72.4%) | 2,062 (83.7%) | 966 (70.7%) |
| Private room | 1,291 (26.6%) | 391 (15.9%) | 392 (28.7%) |
| Hotel room | 22 (0.5%) | 9 (0.4%) | 6 (0.4%) |
| Shared room | 28 (0.6%) | 1 (0.0%) | 3 (0.2%) |
The entire-home share describes the mix of the supply: a city where most listings are rooms in an occupied home is a different market from one made of whole flats. It says nothing on how many homes in the city are used this way.
The active share shows how much of what is listed shows signs of recent stays. A listing can stay online for months without guests; counting only active homes keeps prices and nights from being diluted by listings nobody books.
Both shares are percentages of listings, not of the housing stock. They can be compared across all five cities.
Source: STR Barometer from Inside Airbnb data (CC BY 4.0), snapshots Brussels 20 September 2026; Antwerp 23 September 2026; Ghent 22 September 2026; Dublin 17 September 2026; London 17 September 2026. Methodology.
STR Barometer, “Entire homes”, from Inside Airbnb data (CC BY 4.0), snapshots: Brussels 20 September 2026, Antwerp 23 September 2026, Ghent 22 September 2026, Dublin 17 September 2026, London 17 September 2026. https://strbarometer.com/indicators/entire-homes/